People involved: Aymeric Ferron, Leni Yang, Adrien Corn, Yvonne Jansen, Pierre Dragicevic and Martin Hachet
Abstract
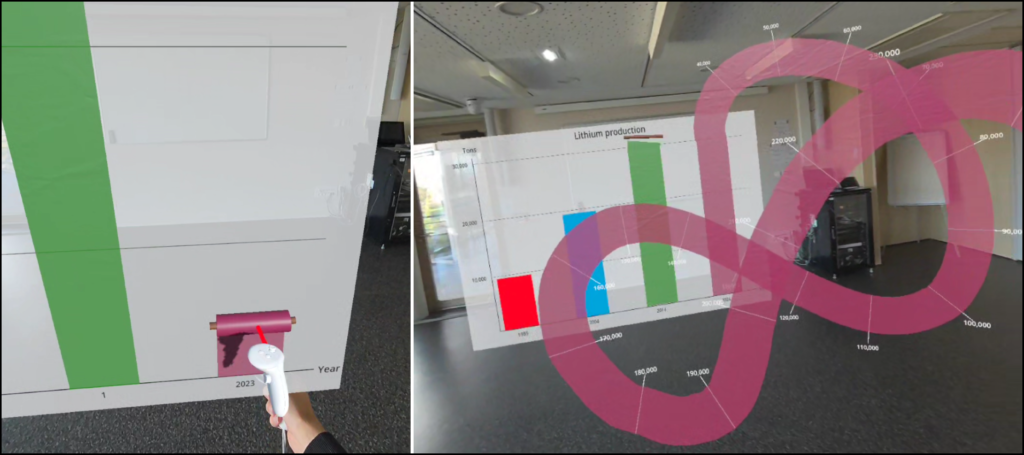
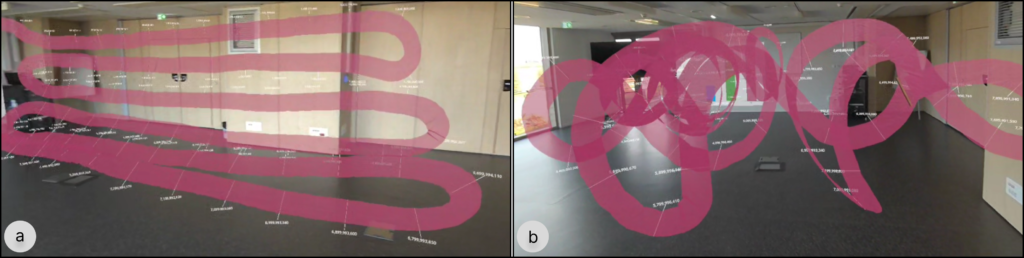
Understanding the difference between small and big values spanning over several orders of magnitude can be difficult. In this paper, we introduce the concept of Data Ribbons, visualizations allowing people to playfully unroll the biggest values of a bar chart beyond its frame. While the smallest values appear as classic bars on a 2D canvas, participants are invited to pull a roll handle and to unroll ribbons representing the biggest values of the dataset. Ribbons are then unfolded in the space surrounding the participant. As a proof of concept and demo, we introduce AR Data Ribbon, an augmented reality Data Ribbon where the biggest bars unfold as a virtual ribbon. We hope our design could lead to a greater engagement, creative ribbon output patterns and better data understanding.
Publication
Submitted to AVI 2026 – Interactive Demos.
Video
Images